Linear regression in Python
Introduction:
Regression algorithms predict continuous values from predictor variables. Predicting the price of a house based on its characteristics is a good example of regression analysis.In this article, I will implement univariate (one-variable) linear regression in python.
Linear regression? What’s mean?
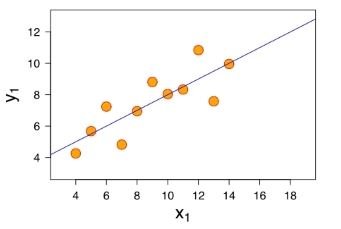
Linear regression is an algorithm that will find a straight line that comes as close as possible to a set of points. Dots represent training data.

Our dots in orange are the input data. They are represented by the couple (x_{i}, y_{i}). The values x_{i} are the predictor variables, and y_{i} is the observed value (the price of a house for example). We seek to find a straight line F(x) = \alpha*x + \beta such that, whatever x_{i}, we want F(x_{i}) \approx y_{i}.
In other words, we want a line that is as close as possible to all the points of our training data.
Presentation of the problem
The problem we are trying to solve and its dataset are those of a course I took on Andrew NG’s Machine Learning on Coursera. At the time I had to implement the solution in MATLAB. I can assure you it was not my cup of tea. 😉
The problem to be solved is the following:
Suppose you are the CEO of a food truck franchise. You are considering different cities to open a new point of sale. The chain already has trucks in different cities and you have data for city profits and populations.
You want to use this data to help you choose the city to open a new point of sale there.
This problem is of the supervised learning type which can be modeled by a linear regression algorithm. It is of the supervised type because for each city having a certain number of population (predictive variable X), we have the gain made in the latter (the variable we are trying to predict: Y).
Data format
Training data is in CSV format. The data is separated by commas. The first column represents the population of a town and the second column shows the profit of a walking truck in that town. A negative value indicates a loss.
\end
The number of records of our input data is 97.
Note: The file can be downloaded here
To solve this problem, we will predict the profit (the variable Y) according to the size of the population (the predictive variable X)
Loading data
First of all, it will be necessary to read and load the data contained in the CSV file. Python offers via its Pandas library classes and functions to read various file formats including CSV.
import pandas as pddf = pd.read_csv("D:\DEV\PYTHON_PROGRAMMING\univariate_linear_regression_dataset.csv") |
The read_csv() function returns a DataFrame. It is an array of two dimensions containing, respectively, the size of the population and the profits made. To be able to use the regression libraries of Python, it will be necessary to separate the two columns in two Python variables.
#selection of the first column of our dataset (the size of the population)
X = df.iloc[0:len(df),0]
#selection of second columns of our dataset (the profit made)
Y = df.iloc[0:len(df),1]
The X and Y variables are now simple arrays containing 97 elements.
Notes:
The len() function returns the size of an array
The iloc function allows you to retrieve data by its position
iloc[0:len(df),0] will retrieve all data from line 0 to line 97 (which is len(df)) located at column index 0
Data visualization
Before modeling a machine learning problem, it is often helpful to understand the data. To achieve this, we can visualize them in graphs to understand their dispersion, deduce the correlations between the predictive variables, etc.
Sometimes it is not possible to visualize the data because there are too many predictor variables. This is not the case here, we only have two variables: population and profits.
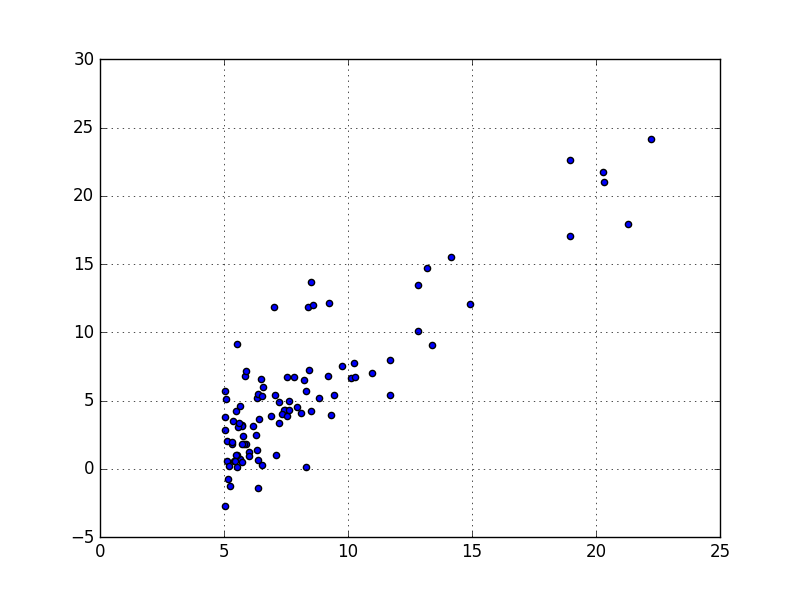
We can use a scatter plot type graph to visualize the data:

It is clear that there is a linear correlation between the variables. And that the more the size of the population increases, the more the profit does the same.
The Python code for making this point cloud is as follows:
import matplotlib.pyplot as plt

axes = plt.axes()
axes.grid() # draw a grid for better readability of the graph
plt.scatter(X,Y) # X and Y are the variables we extracted in the previous paragraph
plt.show()
Notes:
Matplotlib is the python library allowing to make graphs of several types:
Histograms
Point Clouds,
Draw function curves
Pie plot diagrams
etc.
Apply the algorithm
Now that we better understand our data, we will tackle the heart of the problem: Find a predictive function F(X) that will take a population size as input, and produce an estimate of the expected gain as output. The idea of the game is that the prediction is close to the observed value F(X) \approx Y.
Note: For the sake of simplicity, I have chosen not to split my data from the CSV file into Training Set and Test Set. This good practice, to be applied in your ML problems, helps to avoid over-learning. In this article, our data will be used both to train our regression algorithm and also as a test set.
To use linear regression with one variable (univariate), we will use the scipy.stats module. The latter has the linregress function, which allows you to do linear regression.
from scipy import stats
#linregress() returns several return variables. We will be interested
# especially on slope and intercept
slope, intercept, r_value, p_value, std_err = stats.linregress(X, Y)
Make predictions
After the linregress() function has returned the parameters of our model: slope and intercept, we can make predictions. Indeed, the prediction function will be of the form:
We can write this function F(x) in python as follows:
def predict(x):
   return slope * x + intercept
Thanks to this function, we can make a prediction on our 97 populations which will give us a straight line.
#the variable fitLine will be an array of predicted values from the array of variables X
fitLine = predict(X)
plt.plot(X, fitLine, c='r')
Indeed, we can clearly see that the red line approaches all the points of the data set as closely as possible. Pretty isn’t it? 🙂
If we take the 22nd line of our CSV file by chance, we have the population size which is: 20.27 * 10,000 people and the gain made was: 21.767 * $10,000
By calling the predict() function that we defined previously:
print predict(20.27)
# return : 20.3870988313
We obtain an estimated gain close to the true observed gain (with a certain degree of error)
